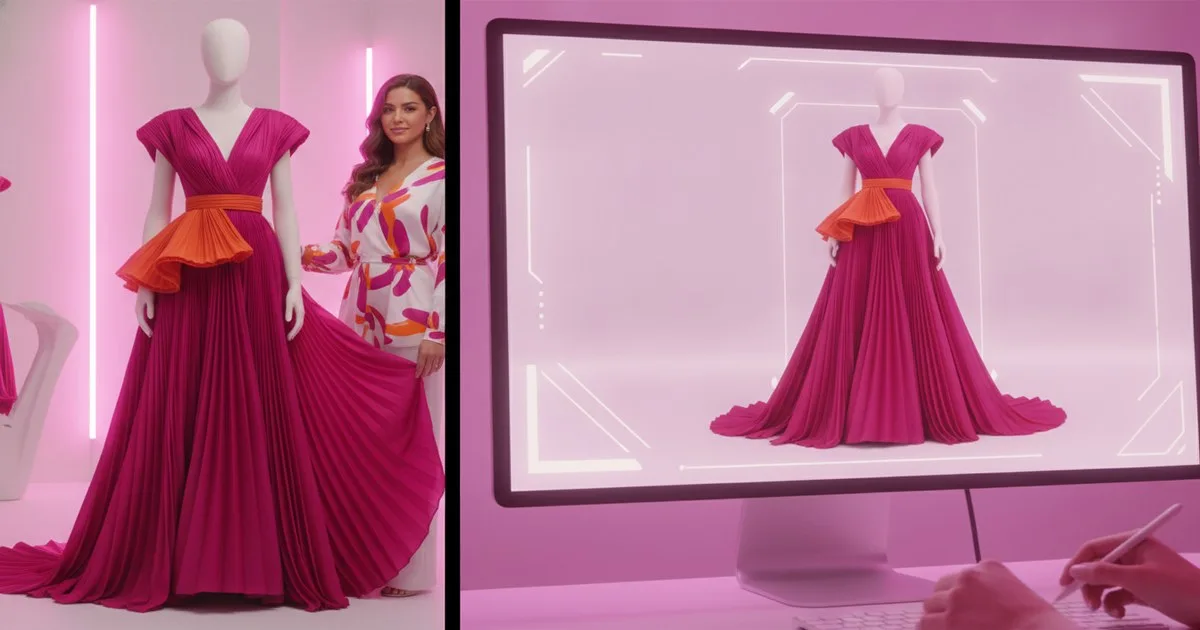
Building a business case for 3D sampling requires moving beyond the novelty of digital renders to focus on the hard financial metrics of product development. To secure executive buy-in, you must quantify the reduction in physical prototypes, the compression of calendar weeks, and the mitigation of shipping costs across your entire supply chain. This guide provides the specific inputs and structural framework needed to present a credible ROI calculation to your finance leads.
Key takeaways
- Physical sampling costs often hide 20–30% in "invisible" expenses like courier fees, duty, and waste disposal that 3D eliminates.
- A successful business case treats 3D adoption as a business process change rather than a simple software installation.
- Reducing revision rounds from four to one can shave six weeks off a standard development calendar.
- Digital twins enable early sell-in and marketing activities, decoupling revenue generation from physical production timelines.
- ROI calculations must include the "learning curve" period where productivity temporarily dips before scaling.
What you need before starting
To build a robust model, you will need access to the following data points from the last four seasons:
- Average cost per physical sample: Include fabric, trim, labor, and factory overhead.
- Logistics costs: Total annual spend on international couriers for prototypes.
- Sample count per style: The average number of physical iterations (Proto 1, Proto 2, Size Set, Salesman Sample) before production approval.
- Development calendar duration: The number of days from initial design brief to final factory handover.
- Markdown data: Historical losses attributed to late-to-market styles or fit-related returns.
Step 1: Audit your current physical sampling costs
Your first task is to uncover the true cost of a single physical garment iteration. Most brands only look at the factory invoice, but the real cost is significantly higher. You must account for the internal time spent by your technical designers and the logistical friction of moving physical goods.
Identify the "landed cost" of a sample. This includes the factory’s surcharge for small-batch development, the cost of air-freighting a single garment from an overseas hub, and the administrative time spent tracking these shipments. In many enterprise environments, a single jacket prototype can cost upwards of $1,500 when all variables are included.
Expected Result: A clear "Baseline Cost per Style" that serves as the primary comparison point for your digital transition.
Step 2: Quantify the speed-to-market advantage
Speed is the most significant competitive lever in modern retail. According to the McKinsey State of Fashion reports, brands that prioritize agility and digital integration are better positioned to handle market volatility. You need to translate "days saved" into "dollars earned."
Map out your current timeline. If it takes 14 days to produce a physical sample and another 4 days for it to clear customs and arrive at your office, that is 18 days of dead time. In a 3D workflow using tools like Browzwear, a digital twin can be reviewed and adjusted in real-time. If you can eliminate two physical rounds, you gain over a month of selling time or a month of additional trend-alignment time.
Expected Result: A "Days Saved" metric that demonstrates how 3D sampling allows the brand to react to trends closer to the point of sale.
Tip: When presenting to finance, frame speed as "risk mitigation." The later you commit to a design, the less likely you are to produce inventory that doesn't sell.
Step 3: Calculate the reduction in revision rounds
One of the most common drains on resources is the "ping-pong" of physical samples. A garment arrives, the fit is slightly off, a comment is made, and the process starts over. This cycle is where 3D sampling provides the most immediate relief.
Analyze your historical data to find the average number of rounds. If your average is 3.5 rounds and 3D can reduce that to 1.5, you are saving two full cycles of material, labor, and shipping. Use this to calculate the "Direct Savings per SKU." For a brand producing 500 SKUs a year, saving $1,000 per SKU in sampling costs results in a $500,000 annual saving—often enough to cover the entire digital transformation budget in year one.
Expected Result: A projected annual saving figure based on the reduction of physical units produced.
Step 4: Map the implementation and training costs
Finance leads are naturally skeptical of "pure savings" without a clear view of the investment required. To maintain credibility, your business case must be transparent about the costs of change. This is not just about software; it is about a fundamental shift in how your team works.
List the following expenses:
- Software Licenses: Annual recurring costs for 3D design and visualization tools.
- Hardware Upgrades: High-performance GPUs and monitors required for rendering.
- Training: The cost of upskilling pattern makers and designers (or hiring 3D specialists).
- Integration: Connecting 3D assets to your existing Centric PLM or other Product Lifecycle Management systems to ensure a single source of truth.
Expected Result: A total "Investment Required" figure for years 1, 2, and 3.
Step 5: Factor in the "Business Change" vs. "Tech Sprinkle"
A common mistake is treating 3D as an add-on to existing processes. As noted in recent industry analysis on business growth and change, technology should be "native" to the process, not just "sprinkled" on top. This means your business case should account for a period of process redesign.
You should include a 3–6 month "Learning Curve" buffer where productivity might stay flat while the team adapts to new digital standards. Acknowledging this shows the executive team that you have a realistic plan for adoption, not just an optimistic forecast.
Expected Result: A phased rollout plan that accounts for the human element of digital transformation.
Step 6: Synthesize the ROI and sensitivity analysis
Combine your savings (Step 1-3) and your costs (Step 4-5) into a final ROI table. To make it bulletproof, include a "Sensitivity Analysis." This shows how the ROI changes if you only achieve 50% of your goals versus 100%.
ROI Comparison Table
| Metric | Physical Sampling (Status Quo) | 3D Sampling (Target State) | Business Impact |
|---|---|---|---|
| Cost per Iteration | $500 - $2,000 | $20 - $100 (Labor-only) | 90% reduction in variable cost |
| Turnaround Time | 14 - 21 days | 2 - 24 hours | Faster reaction to market trends |
| Shipping/Logistics | $150k - $500k/year | < $10k/year | Direct bottom-line impact |
| Sample Waste | 4,000 units/year | 800 units/year | Significant ESG/Sustainability gain |
| Best For | Final production gold seal | Design, fit, and sales buy-in | Efficiency and scale |
Expected Result: A final Net Present Value (NPV) or Internal Rate of Return (IRR) for the project.
Troubleshooting common business case pitfalls
- The "Perfect Fit" Trap: Don't claim that 3D will eliminate all physical samples. Finance will see through this. Always budget for one final physical "Gold Seal" sample to verify factory construction.
- Ignoring the Supply Chain: If your factories aren't ready to receive 3D files, your business case will fail. Include a section on vendor onboarding or mention how you will use industry events like PI Apparel to find tech-ready manufacturing partners.
- Underestimating Data Integrity: 3D is only as good as the fabric data you put in. Ensure your budget includes a fabric testing kit or a digital fabric library subscription.
What success looks like
A successful 3D adoption doesn't just save money; it changes the culture of the brand. Success is when your design meetings happen around a screen rather than a rack of half-finished prototypes. Within 12 months, you should see a measurable decrease in the "rejection rate" of styles at the sales meeting, as 3D allows for more experimentation and better visualization before any fabric is cut. For more on the long-term evolution of these tools, see our Company Profile: Browzwear — 3D Sampling's Longest-Running Bet.
FAQ
How do I calculate the ROI of 3D sampling if we are a small brand?
Focus on shipping and time. For smaller teams, the cost of international couriers and the "opportunity cost" of waiting for samples are the biggest drains. If 3D saves you 20 days of waiting, that is 20 days you can spend on marketing or sales, which has a direct impact on cash flow.
Can 3D sampling really replace physical fit sessions?
It can replace 70–80% of them. While a final physical sample is still recommended for tactile verification and final construction checks, digital avatars allow you to identify 90% of fit issues—such as tension, drag lines, and proportion—before the first piece of fabric is ever cut.
What is the biggest hidden cost in a 3D business case?
Data preparation. To get accurate 3D renders, you need digital versions of your fabrics (U3M or similar files) and accurate digital patterns. If your current patterns are messy or your fabric data is non-existent, you will need to invest time in "cleaning" this data before the software can provide value.
How does 3D sampling impact sustainability reporting?
It provides hard data for ESG (Environmental, Social, and Governance) reports. You can quantify the reduction in carbon emissions from eliminated air freight and the reduction in textile waste from prototypes that would otherwise end up in a landfill or sample sale.
Further reading
- McKinsey & Company: The State of Fashion
- Crunchbase: AI-Native vs AI-Sprinkle Business Change
- Browzwear
- Centric PLM